Restaurant growth depends on one simple habit: understanding what is your customer return time and how often they order from you. A study in ScienceDirect shows that the average dining customer takes 89 days to return. That is almost three months of lost revenue.
Your own internal order data usually tells the same story. It shows how many orders you get, which channels drive those orders, and how long customers take before they return. When you reduce this return time, also called Time Between Orders, you increase repeat visits, improve retention, and grow revenue without spending extra on marketing.
This is exactly why we have Order Dashboard under smart insights. It gives you a clear view of your real numbers and helps you take action instantly.
Let us walk through the three modules that help you understand your business and grow it every single day.
1. How Many Orders Is Your Business Actually Getting?
Most restaurant owners rely on gut feeling. Reelo shows you what is really happening.
You can view your orders by day, week, month, last 3, 6, or 12 months, and even year on year. One quick look gives you a complete picture of your patterns. You see which days are strong and which days need improvement.
What you can interpret
- Your peak and low performing weeks
- Which days need support
- Whether overall growth is moving up or stagnating
- Whether kitchen staffing needs adjustment
- Whether your menu or pricing works consistently
Look at this example screenshot

In the screenshot above, the business received 18,863 orders in the last 12 weeks. That is an average of 1,451 orders per week.
Some insights stand out immediately:
- The week of 29 Sep to 5 Oct peaked at 1,701 orders.
- The week of 1 Dec to 3 Dec dropped sharply to 492 orders.
- Most weeks stay between 1,400 to 1,600 orders, which shows healthy consistency.
On the right, the dashboard shows a 15.87 percent year on year increase, which means the business is growing compared to last year.
This kind of visibility helps you take smarter actions. For example, if the first week of December is always weak, you can plan a targeted offer or a loyalty push to fill that gap.
What you can do with Reelo
Reelo helps you turn data into action.
For example, if your Monday orders are too low:
- Run a Monday special for weekly customers
- Offer a combo meal
- Give double loyalty points
- Target customers within a 3 kilometer radius
If your average order value is 600 rupees and you add 120 extra orders per month, that is 72,000 rupees of new monthly revenue created from a single insight.
Use Reelo to run campaigns, boost slow days, reward loyal customers, and bring back slipping customers in a structured way.
2. What Is the Trend Across All Order Channels?
Every restaurant operates through three major channels: dine in, takeaway, and delivery. Most owners know their rough mix, but very few know the actual numbers or trends.
Reelo shows you your channel split in a simple, clear view.
Why this matters
If you run a casual or fine dining restaurant, dine in should lead because your experience and margins depend on it. If delivery starts overtaking dine in, it means you are competing only on food and not on experience.
If you run a cloud kitchen, delivery and takeaway should lead. If dine in starts showing growth for a cloud kitchen, that usually means your brand is strong enough to attract visits but your space is not being leveraged.
If you run multiple formats, knowing which customers prefer which channel helps you market differently to each segment.
Let us Look at this example screenshot
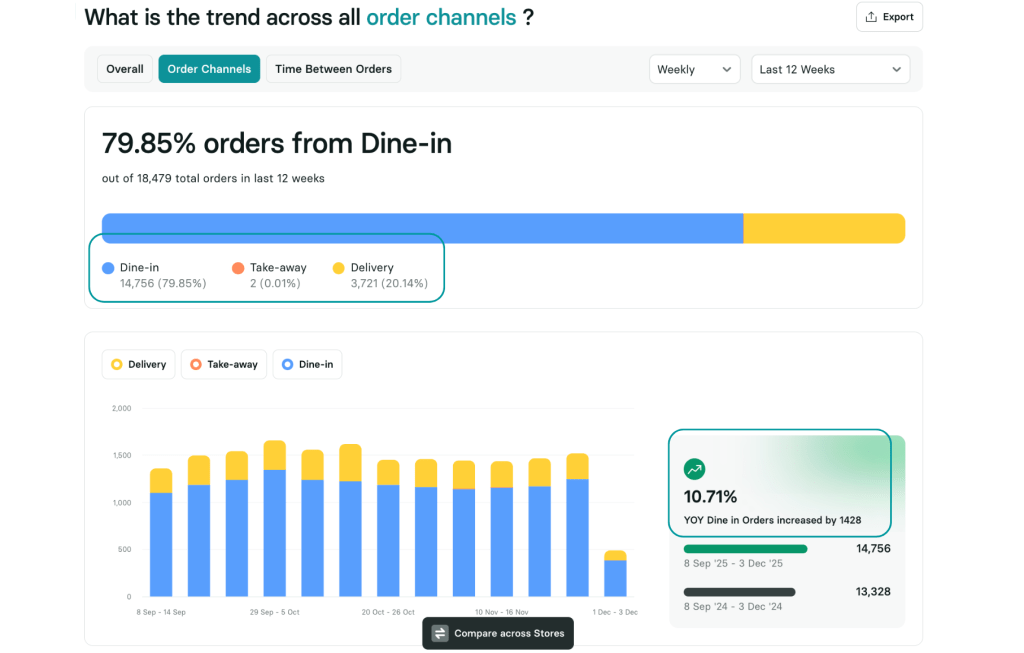
In the screenshot, 79.85 percent of all orders come from dine in. Delivery contributes 20.14 percent and takeaway is almost nonexistent at 0.01 percent.
The weekly graph shows that:
- Dine in stays consistently dominant
- Delivery spikes during weekends
- Takeaway does not grow at all
On the right, a 10.71 percent year on year increase in dine in orders shows that in store experience is improving.
This immediately tells you what to focus on:
- If dine in is your strongest channel, you should reward dine in loyalty.
- If delivery spikes during weekends, run weekend only combos or rain day offers.
- If takeaway is almost zero, start a pickup and save program to build that channel, which has the highest margins.
How you can act with Reelo
You can create dine in exclusive offers, target customers near your restaurant for takeaway deals, or send reorder nudges for delivery. Each move strengthens the channel you want to grow.
Smart restaurants manage channels, not just orders. Reelo makes that simple.
3. Is Customer Return Time Improving?
This is often the most ignored metric, but it is the one that impacts revenue the most.
Time Between Orders (TBO) measures how long a customer takes before they order again. Lower is always better.
Why TBO matters
Indian restaurants depend heavily on repeat customers. When customers take too long to return:
- Revenue slows
- Marketing costs rise
- Loyalty weakens
- Growth becomes unpredictable
Remember, the industry average is 89 days for a repeat visit. Your goal should be to beat this number consistently.
Let us look at this example
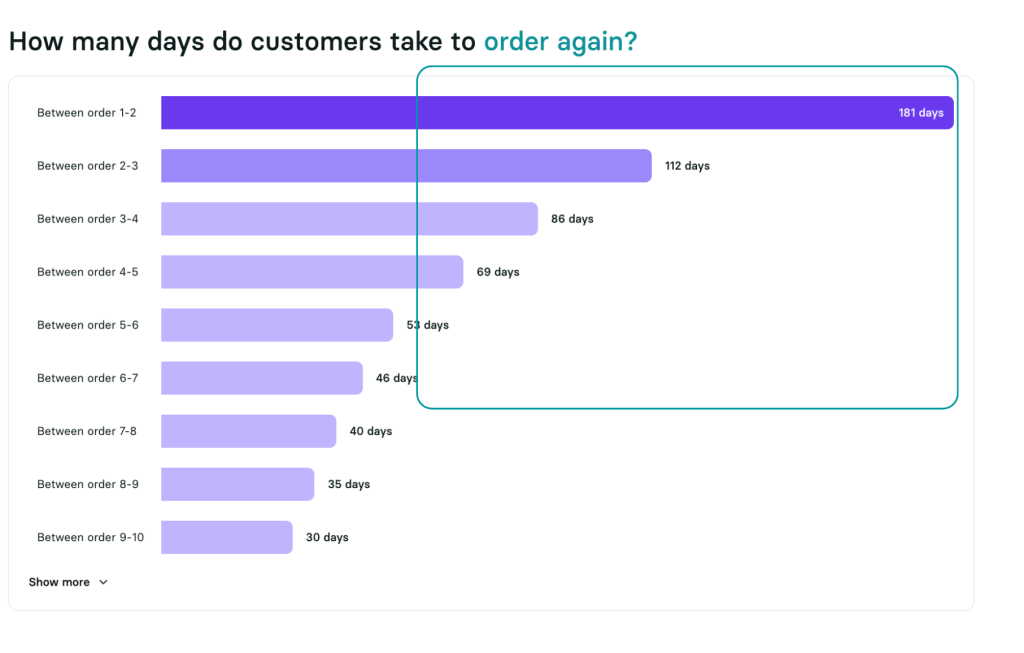
The screenshot shows exactly how many days customers take between each order.
- Between order 1 and 2: 181 days
This is the biggest drop. First time customers are not returning quickly enough. - Between order 2 and 3: 112 days
Still long but improving. - Between order 3 and 4: 86 days
- Between order 5 and 6: 53 days
- Between order 9 and 10: 30 days
This is a classic pattern. Once customers reach their fifth or sixth order, they return faster. The real challenge is bringing them back in the early stages.
How Reelo helps you reduce return time
Reelo sends personalized reminders based on each customer’s pattern. For example:
- A gentle nudge three weeks after their last visit
- A win back offer if they cross 60 days
- A membership invitation for slow return customers
- Automatic feedback recovery for unhappy guests
- VIP perks for your top spenders
- Reorder reminders based on personal habits
When you do this consistently, your return time drops. And when TBO drops, revenue rises.
For example:
If a customer spends 800 rupees per visit:
At 89 days TBO, they spend about 3,288 rupees a year.
At 45 days TBO, they spend about 6,489 rupees a year.
That is double the revenue without acquiring a single new customer.
Scale that across 500 customers and you get more than 16 lakh rupees in additional annual revenue.
The Result: A Restaurant That Knows Its Numbers will improve Customer Return Time
Most restaurant owners rely on instinct. The best performing restaurants rely on insights and action. Reelo gives you both in one place.
You do not need complex reports or multiple systems. You open your dashboard, understand your business in minutes, and act in seconds. Reelo takes care of the execution.
Every Extra Order Counts
Use Reelo to turn insights into daily revenue
About The Author