Introduction: The Secret Number That Grows Your Revenue Without New Customers
Most restaurant owners obsess over foot traffic. More customers, more sales, more growth.
But here’s what the numbers actually say: if you’re serving 100 customers a day at an Average Order Value of ₹1,200, just getting each person to spend ₹120 more adds ₹12,000 daily. That’s ₹3.6 lakh a month without a single new customer, without hiring more staff, without overwhelming your kitchen.
The fastest way to grow isn’t always to get more people through the door. It’s to increase what the people already coming through spend.
That’s why Average Order Value (AOV) and Average Per Customer (APC) are two of the most underused and most powerful metrics in your business. When you understand them, revenue growth stops being a guessing game.
Let’s break down exactly how Reelo’s dashboard helps you track, understand, and improve these numbers.
Understanding Restaurant AOV and APC

What is AOV?
Average Order Value (AOV) measures how much a customer spends in a single visit. It’s the clearest snapshot of transaction-level behavior.
What is APC?
Average Per Customer (APC) measures how much a customer spends across all their visits over time. It’s the big picture—lifetime value in action.
Example
A customer visits three times in a week. They spend ₹400, ₹400, and ₹650.
- AOV = ₹483 (average per visit)
- APC = ₹1,450 (total across visits)
AOV shows you how valuable each transaction is. APC shows you how valuable each customer is to your business.
Master both, and you unlock predictable, compounding growth.
How to Understand your Restaurant AOV and APC Using Reelo’s Dashboard
Reelo’s Insights Dashboard turns raw sales data into visual patterns you can act on immediately. Every chart answers a specific growth question. No guesswork. No spreadsheets. Just clarity.
Here are the four most important views and what to do with what they reveal.
1. Track Whether Your Restaurant AOV Is Growing Over Time

Your AOV Overview shows daily, weekly, and monthly spending trends. It surfaces patterns that would otherwise stay invisible in your transaction logs.
You might discover:
- Weekday AOV drops to ₹900 while weekends stay at ₹1,500
- A new combo you launched caused a 22% spending spike
- Festive weeks consistently push AOV up by ₹300+
- A seasonal slump happens every March
If your last 30 days show an AOV of ₹1,810 and last year it was ₹637, that’s a 2.8x jump. Something you did (menu changes, pricing adjustments, better upselling) is working. Now you can double down.
What this tells you
- When customers naturally spend more (and when they don’t)
- Whether recent experiments are moving the needle
- Where easy revenue is hiding in plain sight
What you can do
- If weekdays are weak, introduce a “Tuesday Combo” or weekday-only add-on
- If a spike appears after launching a new item, promote it harder
- If AOV drops suddenly, audit your menu flow, pricing, or service speed
AOV is one of the fastest metrics to improve because small changes create immediate results.
2. Compare Order Channels To Find Your Highest Value Source
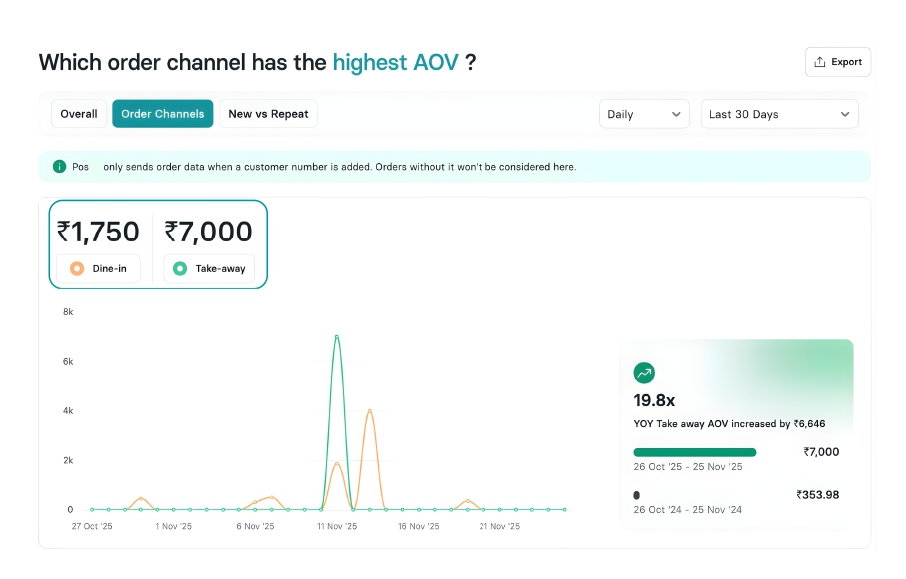
Not all orders are created equal. Dine-in, takeaway, and delivery customers behave differently and spend differently.
You might find:
- Takeaway AOV: ₹7,000
- Dine-in AOV: ₹1,750
That 4x gap isn’t random. It likely means bulk orders, party packs, or group meals are happening through takeaway. Your highest-value customers aren’t sitting in your restaurant. They’re ordering from home or the office.
What this tells you
- Which channel drives your most profitable orders
- Whether dine-in guests need better prompts to spend more
- If your delivery presence is underperforming
What you can do
- If dine-in AOV is low, train staff to suggest pairings or highlight add-ons on the menu
- If takeaway has high AOV, promote family meals, office lunch bundles, or party packs more aggressively
- If delivery fluctuates, improve your online menu—better photos, clearer descriptions, smarter combos
When you know which channel prints money, you know exactly where to focus your energy.
3. Understand Customer Value With the APC Dashboard
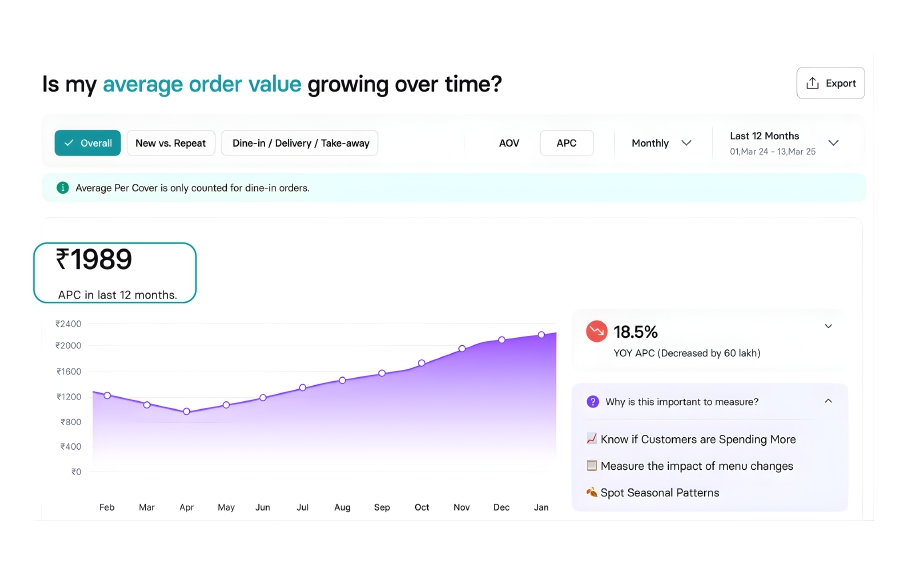
APC isn’t about visits or frequency. It’s about total spending power. A customer who comes twice and spends ₹2,000 each time is more valuable than someone who comes five times and spends ₹500 total.
For example, your dashboard might show:
- APC over the last 12 months: ₹1,989
- Year-over-year APC drop: 18.5%
That drop is a warning signal. Either customers are coming back less often, spending less per visit, or reacting poorly to something you changed.
What this tells you
- Whether customers are growing more valuable over time or slipping away
- How menu updates or price changes affect long-term spending
- Seasonal patterns in customer loyalty and spending
What you can do
- If APC drops, check whether your regulars are returning less frequently
- Send soft nudges like “We missed you” offers or loyalty rewards to bring them back
- Personalize recommendations based on past orders to encourage larger purchases
APC tells you whether you’re building a business on one-time customers or loyal, high-value relationships.
4. Compare Restaurant AOV of New vs Repeat Customers
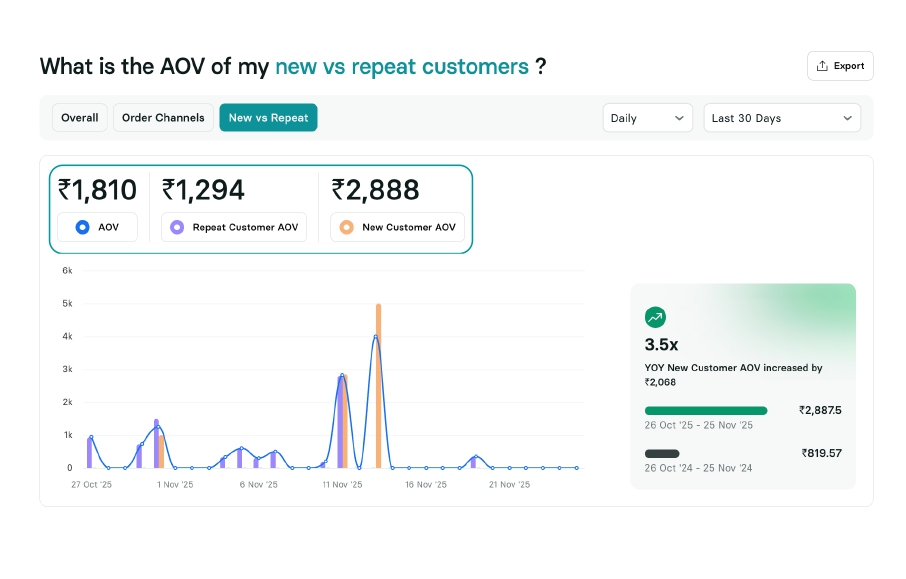
First-time customers and loyal regulars don’t spend the same way. This view shows you exactly how each group behaves and where the opportunity lies.
You might discover:
- New customer AOV: ₹2,888
- Repeat customer AOV: ₹1,294
- Overall AOV: ₹1,810
If new customers are spending more than twice what regulars spend, it suggests they’re trying multiple items or ordering for groups. But if they’re not coming back, you’re leaving money on the table.
If repeat customers spend less, they’ve likely settled into a routine (same dish, same size, every time). That’s where targeted nudges can unlock hidden revenue.
What this tells you
- Whether your acquisition strategy brings high spenders or low spenders
- How spending habits evolve from first visit to loyalty
- Which group has more room to grow
What you can do
- If new customers spend big, hit them with a strong “welcome back” offer within 48 hours
- If repeat customers plateau, introduce curated add-ons based on their order history
- If one group consistently underperforms, tailor your communication. Don’t send the same message to everyone
When you understand how each customer segment spends, increasing AOV stops being a gamble. It becomes a formula.
Conclusion: Better Visibility Leads to Better Decisions
Your AOV and APC dashboards don’t just show numbers. They tell stories about customer behavior, spending patterns, and where your restaurant is unknowingly leaving revenue on the table.
With these insights, your decisions become sharper. Your growth becomes intentional. You stop hoping for more customers and start maximizing the ones you already have.
Because the truth is, you don’t need a bigger crowd. You just need a clearer view of the one that’s already walking through your door.
Want to understand your customers better and grow your AOV with clarity?
See exactly where your revenue opportunities are hiding. Track your AOV and APC trends in real time with Reelo’s Insights Dashboard. Book your demo
About The Author